


TWC Research
TWC’s Transit Workforce Data Dashboard: Findings and Use Cases
TWC’s Transit Workforce Data Dashboard illustrates critical employment and demographic data in public transportation that can aid industry decision-making. This blog post highlights TWC’s key takeaways from the data and offers examples of how to incorporate this information when making workforce decisions. The Dashboard helps guide decisions on three major workforce topics: Workforce Needs, Recruitment & Retention, and Skills and Training Needs.
Workforce Needs
Employment data help assess current workforce demands and predict future job needs based on current trends.
For example, total openings in several key transit-related occupations are projected to exceed current employment between 2023 and 2033, illustrating the need for extensive hiring strategies. In 2023, there were 194,100 transit and intercity bus drivers currently employed, but the Bureau of Labor Statistics projects there will be 247,000 openings over the next decade.
2023 Employment and 2023 to 2033 Total Openings
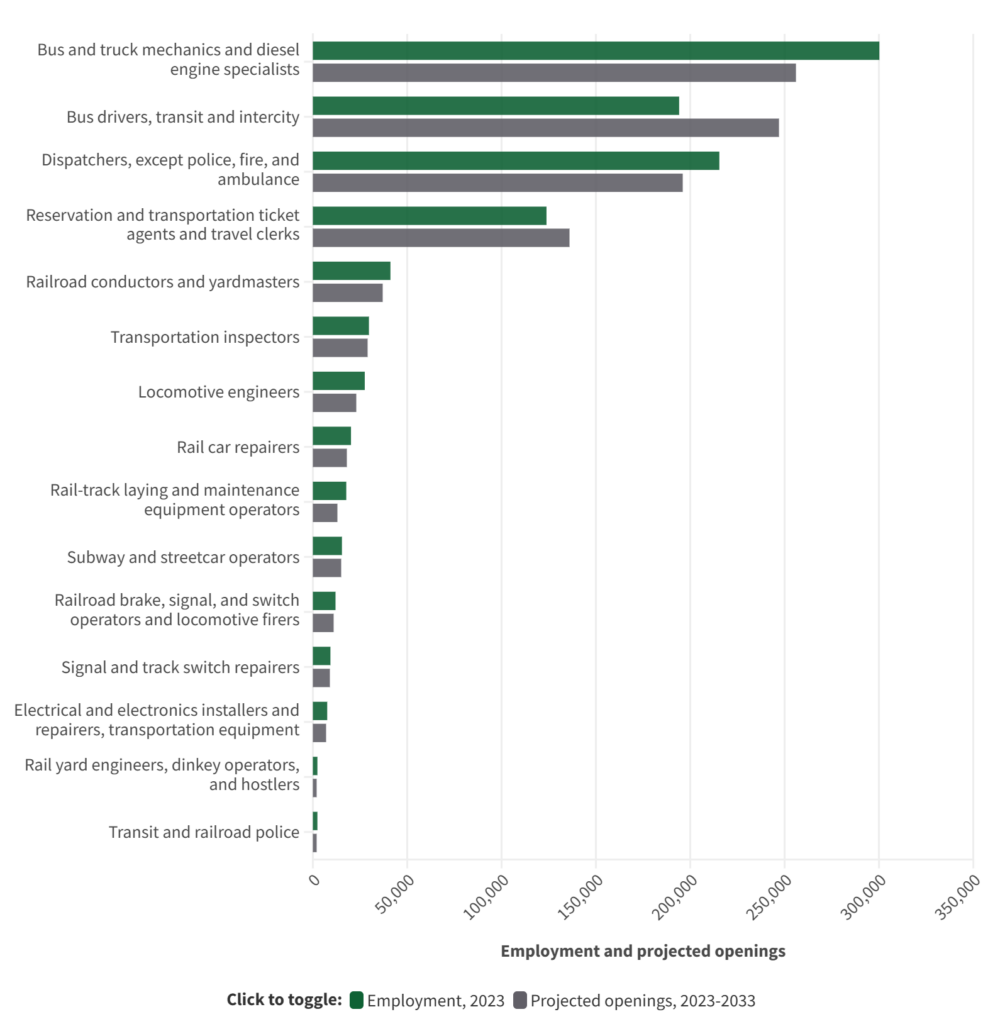
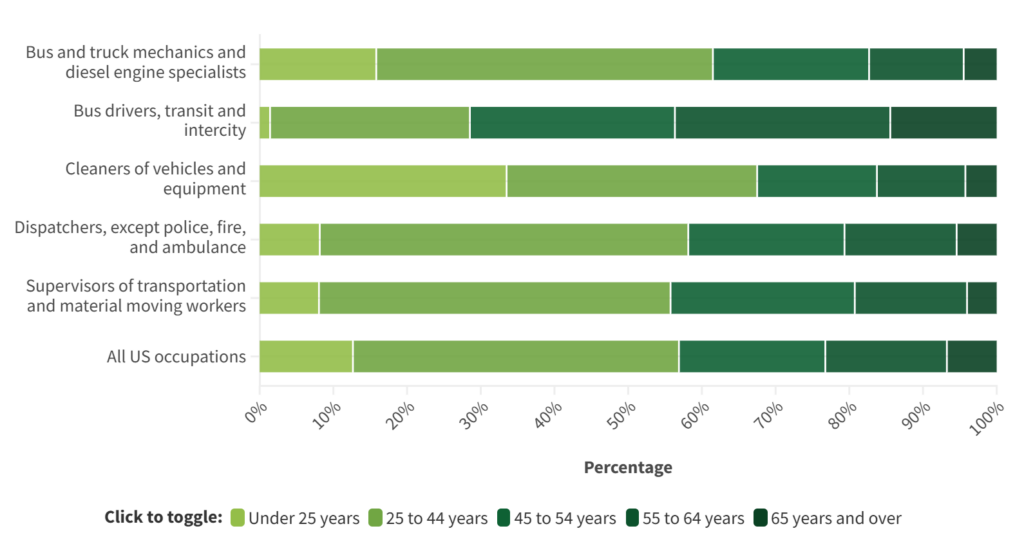
Of the occupations analyzed, bus drivers (transit and intercity) will see the highest rate of employment growth over ten years (5.2%) and the second highest annual rate of separations, or workers leaving the occupation (11.9%). Higher rates of separation could be due to the higher average age of bus drivers as many of them are reaching retirement age; 71.5% are over the age of 45, as the chart below illustrates.
Employment by Age in 2023
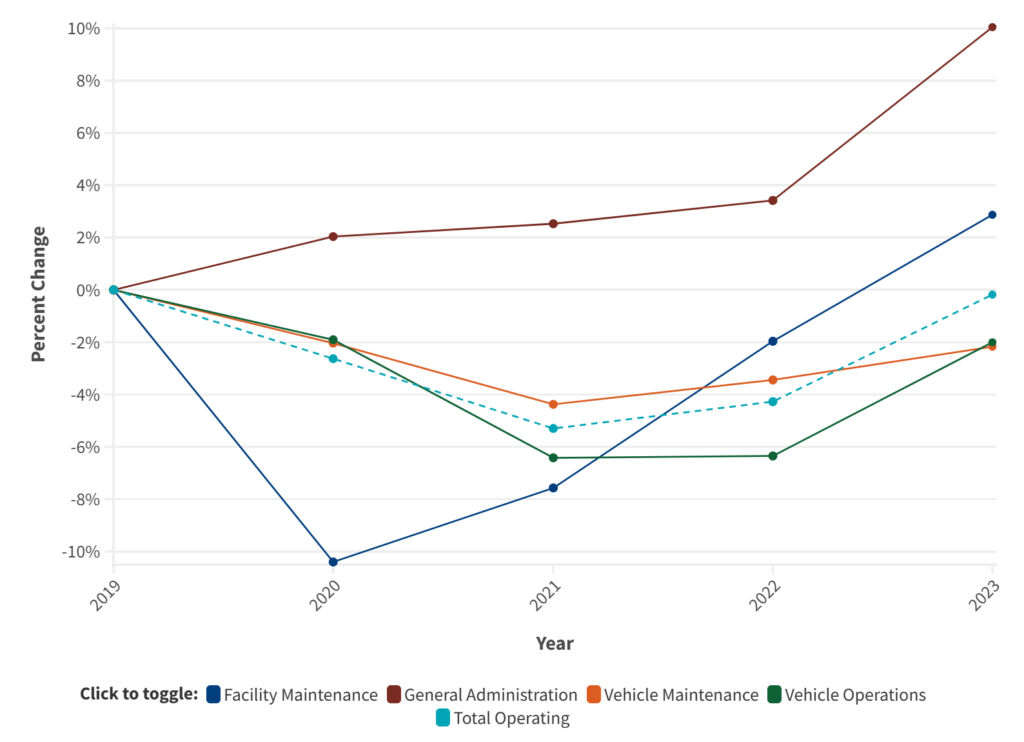
The data in the Dashboard provide evidence of a workforce shortage. While ridership has rebounded since the pandemic, high rates of occupational separation and an aging workforce continue to pose challenges for the transportation workforce. Employment in vehicle operations and vehicle maintenance both saw decreases of about two percent since 2019.
Percent Change in Employment by Job Function from 2019 to 2023
Recruitment & Retention
To promote recruitment and retention, employment data can help identify factors that may contribute to employee turnover or low interest among potential applicants, and can inform strategies to enhance job satisfaction and appeal. Looking at average hourly wages, the data indicate cases in which comparatively low wages might be inhibiting recruitment and retention of workers. Agencies may use TWC’s Agency Explorer to check the competitiveness of their wages against others in the region and nationally.
Hourly Wage by Mode from 2019 to 2023
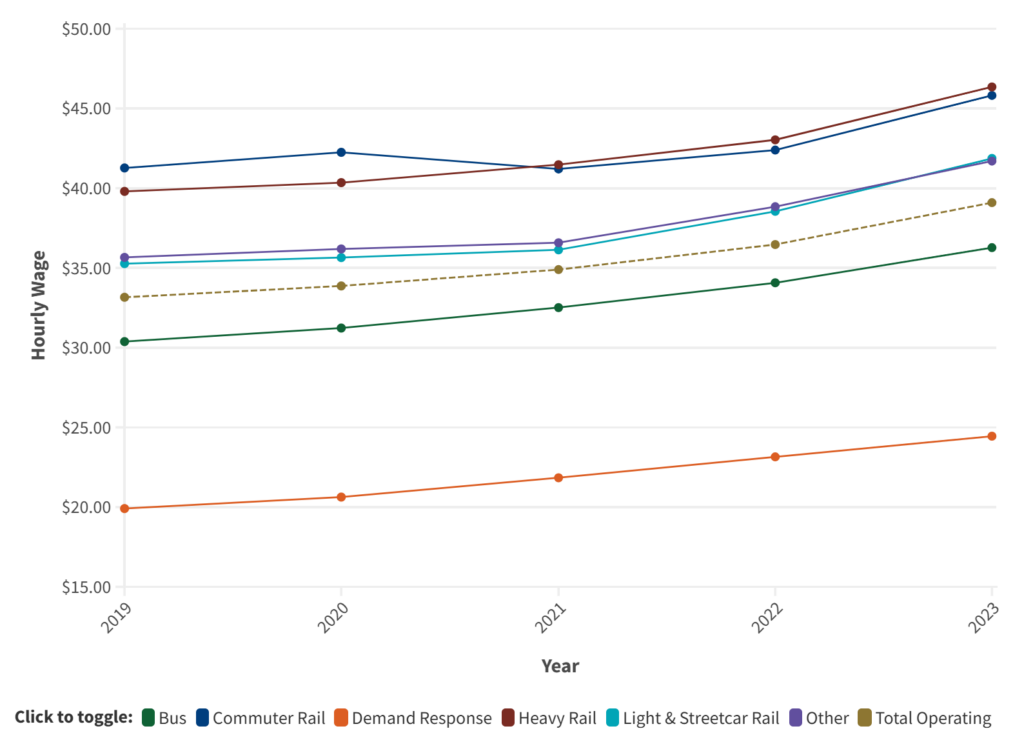
Across agencies, demand-response employees are considerably more likely to be part-time than employees working in other major transit modes and earn notably less per hour on average than their fixed-route counterparts. Increasing wages is one way to improve retention within this occupation.
Skills and Training Needs
The Dashboard’s educational attainment table can help transit agencies and partners identify the need for workforce skill development programs like apprenticeship or pre-apprenticeship. Insight into age, education level, and required training helps design relevant and effective programs.
Education and Training Requirements, Educational Attainment, and Wages in Selected Transportation and Related Occupations
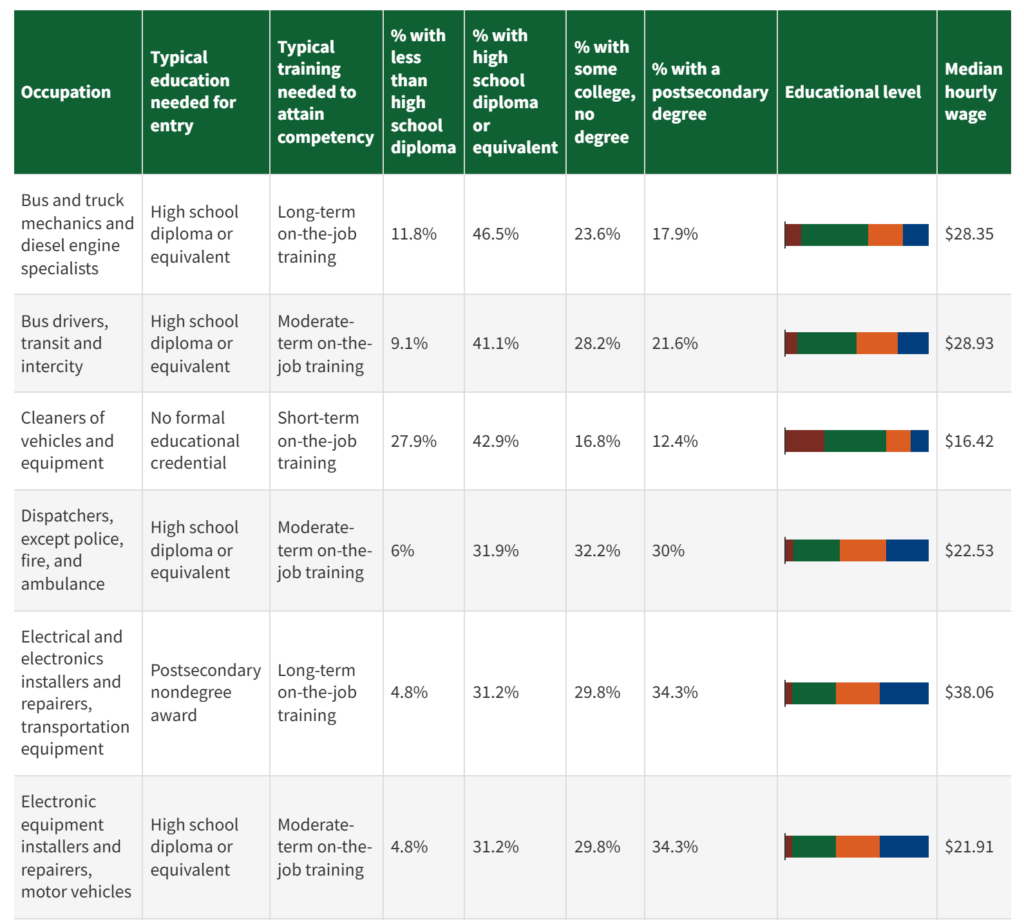
Many key positions require moderate- to long-term on-the-job training but do not require education beyond a high school diploma or equivalent. Thus, it would be beneficial for agencies to develop pathways directly from high schools into transit, while providing foundational and occupation-specific training. This chart helps identify occupations that lend themselves well to apprenticeship programs (i.e., those requiring moderate- or long-term on-the-job training). Jobseekers considering careers in transit can also use this chart to identify suitable occupations based on their current educational qualifications.
In summary, TWC’s Data Dashboard can assist transit providers with key workforce decisions. Employment projections bring attention to the industry’s greatest needs in the coming decade and indicate a demand for committed recruitment and retention efforts. Education and wage data can be used by transit agencies and their partners throughout the country to build a case for transit jobs as good options for non-college workers to earn family-sustaining wages and build middle-class careers. Finally, the Dashboard illustrates wage differences among transit modes and states, and other data on demographics and employment patterns in the transit workforce, which will help focus recruitment efforts on the most urgent actions.
Have any questions or ideas for new ways to engage with workforce data? Contact us at twc@transportcenter.org.
Contributing Authors: Lauren Smith